The Distance to Care: Mapping Wildlife Rehabilitation Coverage Across the United States
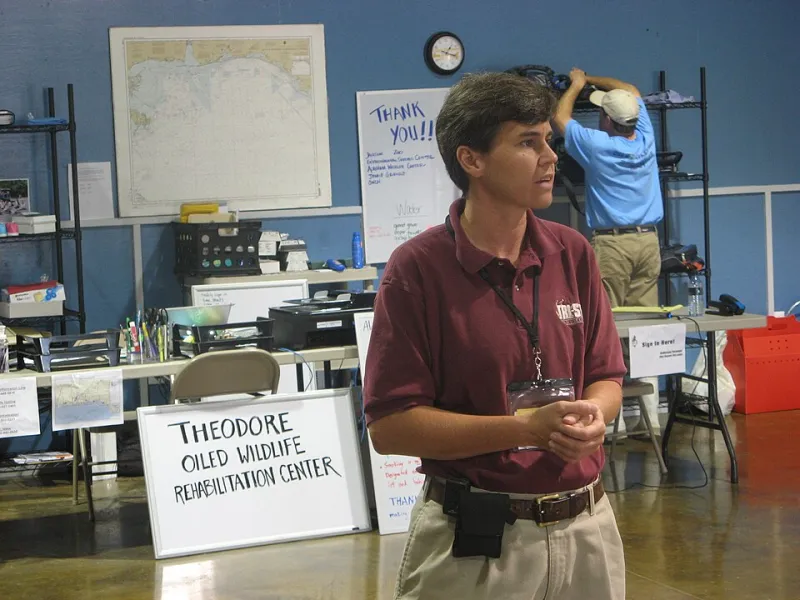
Photo: U.S. Fish and Wildlife Service Southeast Region, Public domain, via Wikimedia Commons
An injured hawk on a roadside, an orphaned raccoon in a suburban yard, a turtle struck on a county highway: the first question is often not what to do but where to take it. In many parts of the United States, the answer depends on a volunteer network, a willing veterinarian, and a drive that may be longer than the animal can survive.
Wildlife rehabilitation is a public service delivered largely by nonprofits and licensed individuals. Its geography is thin and uneven. Mapping that geography is a first step toward strengthening it.
The Shape of a Rehab Desert
A rehab desert is not simply a place with no rehabilitation center. It is a place where the travel time to appropriate care exceeds what an animal, a rescuer, or a volunteer transporter can reasonably manage. The threshold varies by species and injury. A songbird with a fractured wing may tolerate a shorter delay than a bear cub, but a turtle with a shell fracture may need faster stabilization than either.
GIS can model that variability. Using road networks, speed limits, and center locations, analysts can calculate travel-time catchments rather than straight-line distances. Those catchments can be intersected with land cover, road density, and wildlife-vehicle collision data to estimate where injured wildlife are most likely to be found—and how far they are from help.
Why Straight-Line Maps Mislead
A center may appear to serve a large region on a simple radius map. In practice, rivers, mountain passes, and highway patterns can make that region much smaller. A 45-minute drive in one direction may be a two-hour drive in another. For a volunteer transporter, that difference determines whether a rescue is feasible.
Travel-time analysis also reveals overlap and redundancy. Some metropolitan areas may have several centers within an hour, while adjacent rural counties may have none. That pattern matters for fundraising, volunteer recruitment, and public education. It also matters for wildlife agencies that need to know where to route calls.
Species Change the Map
A single national coverage map would be misleading because species-specific needs vary so widely. Raptors require specialized handling and flight cages. Waterbirds may need pools and isolation. Rabies-vector species such as raccoons and skunks are subject to state regulations that can limit which centers can accept them. Reptiles and amphibians may need less space but highly specific thermal environments.
A useful GIS model would therefore include center capabilities, not just center locations. Which centers accept which species? What is their intake capacity? Do they have veterinary support on site or on call? Are they open to public drop-off, or do they require a transporter? These attributes turn a point map into a service network.
The Veterinary Gap
Veterinarians are part of the response network, but their role is often invisible in coverage maps. Some clinics provide initial stabilization, radiographs, or euthanasia services for wildlife. Others do not accept wildlife at all. Mapping veterinary partners alongside rehabilitation centers can reveal another kind of gap: places where an animal can be stabilized but not rehabilitated, or where a center exists but lacks nearby veterinary support.
That distinction matters for policy. A state may have a rehabilitation center in every region but still lack after-hours veterinary capacity. A network map can show where public investment—training, equipment, or transport stipends—would have the most effect.
What a National Spatial Network Could Do
A national wildlife response network would not need to be a new bureaucracy. It could be a shared spatial framework: standardized center profiles, service-area maps, species capabilities, and travel-time models. Wildlife agencies, nonprofits, and veterinarians could contribute to and use the same baseline.
Such a network could support dispatch and referral, volunteer transport routing, and public education. It could help planners understand where road mortality hotspots coincide with care gaps. It could also support grantmaking by showing which regions are genuinely underserved rather than simply remote.
Building It From the Ground Up
The data challenges are real. Many rehabilitation centers are small and volunteer-run; their records may be paper-based or inconsistent. Privacy and wildlife regulations complicate data sharing. A national network should start with a minimal common schema—location, species accepted, contact protocol, capacity—and expand as trust and capacity grow.
In 2026, the practical first step is a regional pilot: map centers, veterinary partners, and collision hotspots in one state or ecoregion; calculate travel-time catchments; and test whether the resulting gaps match what dispatchers and transporters already know. If the map confirms their experience, it becomes a tool for funding and coordination. If it contradicts it, the discrepancy is itself useful.
Care Is a Geographic Service
Wildlife rehabilitation is often treated as an animal welfare issue, which it is. It is also a geographic service, delivered through a fragile network of people and places. Mapping that network will not save every animal. But it can shorten the distance between an injured animal and the care it needs—and make the gaps impossible to ignore.