The Cloud’s Heavy Ground: A Watershed-Scale Screen for Data Center Siting
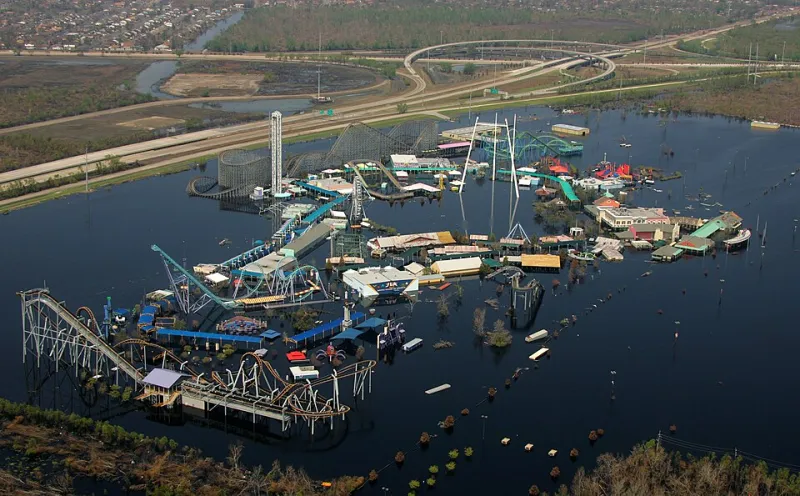
Photo: Bob McMillan; edit: Chris Woodrich, Public domain, via Wikimedia Commons
Data centers are often described as weightless infrastructure: servers, fiber, and electricity moving through buildings that leave little visible trace. On the ground, the footprint is more concrete. Campuses require land, substations, transmission lines, backup generation, and—depending on the cooling design—significant water withdrawals. When several facilities land in the same county or watershed within a few years, the combined effect can exceed what any single permit review was designed to assess.
A Footprint That Arrives in Pieces
Most data center approvals arrive as separate decisions. A rezoning here, a water-service agreement there, an air permit and a transmission interconnection elsewhere. Each application can appear modest when evaluated on its own. The cumulative picture—dozens of parcels assembled into a campus cluster, multiple cooling systems drawing from the same aquifer, new corridors cutting through habitat—is rarely assembled in one place.
That is a spatial problem before it is a policy problem. The relevant unit is not only the individual parcel but the watershed, the transmission corridor, and the habitat patch. Project-by-project review tends to see the building. GIS can see the system.
What the Map Should Hold
A credible screening approach for 2026 would begin with four linked layers. First, cooling-water demand and source: estimated withdrawals by facility type, groundwater or surface-water source, and whether the system is evaporative, closed-loop, or air-cooled. Second, parcel records: ownership, assembly patterns, zoning, and the pace of land conversion around existing campuses. Third, transmission corridors: planned and existing lines, substation capacity, and the habitat and farmland crossed by new rights-of-way. Fourth, land-cover change: impervious surface, tree canopy loss, grassland conversion, and proximity to intact habitat.
Those layers should be normalized to a common geographic unit—likely the HUC-8 or HUC-12 watershed for water and habitat questions, and the county or transmission planning area for land-use questions. The point is not to produce a single score that decides a project. It is to produce a repeatable screen that shows where clusters are forming and which resources are accumulating pressure.
The Cumulative Blind Spot
Water is the clearest example. A single data center may negotiate a water right or service contract that looks manageable. But when three or four facilities locate in the same basin, the combined withdrawal can interact with agricultural demand, municipal supply, and ecological flows. The same is true of transmission. One new line may be justified by reliability; a cluster of lines may fragment a wildlife corridor or open a previously intact landscape to further development.
Land-cover change adds a slower variable. Data centers are often sited on former farmland or at the urban fringe, where parcel assembly can be the leading edge of broader commercial and residential conversion. A watershed-scale screen can flag where a campus cluster is likely to trigger follow-on development, road upgrades, and utility expansion.
None of this argues that data centers should not be built. It argues that the review unit should match the geography of the effect. A project-level permit cannot answer a watershed-level question.
A Screening Framework for 2026
A practical framework can be built in stages. Start with a service-shed map: define the watersheds, aquifers, and transmission planning areas that host existing and proposed campuses. Overlay water stress indicators—groundwater decline, surface-water withdrawals, drought frequency—and habitat intactness layers. Add parcel assembly and land-cover change to identify where clusters are consolidating. Then run scenario screens: what happens if two more facilities are added to this basin, or if a new substation attracts another campus?
The output should be public enough to inform local planning and transparent enough to be audited. That means documented assumptions, versioned data, and clear separation between screening results and regulatory findings. GIS is strongest when it narrows the questions that require deeper analysis, not when it pretends to replace it.
From Screen to Decision
States and counties do not need to wait for a national data set. They can begin with existing public records and a shared watershed boundary. The 2026 opportunity is to make cumulative effects visible early—before the parcels are assembled and the water contracts are signed. A watershed-scale screen will not settle every data center debate, but it can keep the debate honest about the landscape that is actually being changed.