Draining in the Dark: How Geospatial Science Is Finally Measuring the Groundwater Crisis Threatening America's Agricultural Heartland
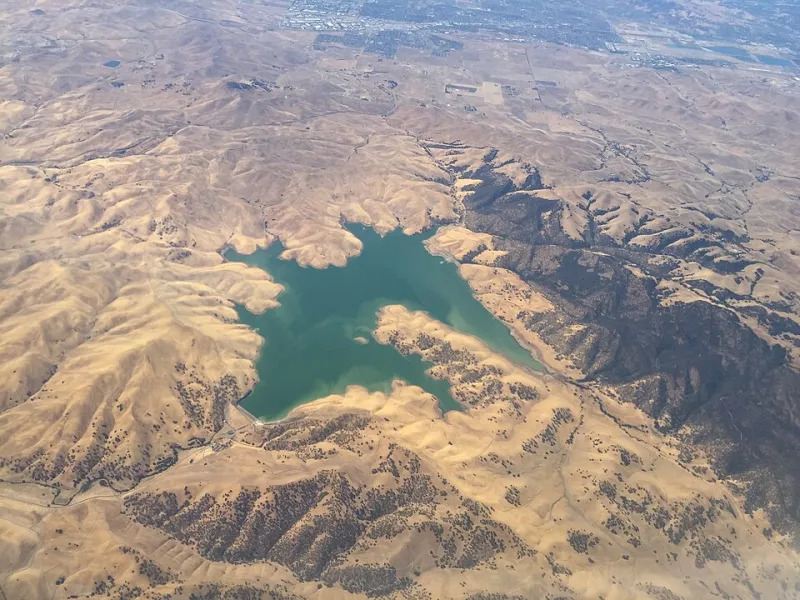
Photo: Judy Gallagher, CC BY 2.0, via Wikimedia Commons
Groundwater does not announce its disappearance. There are no visible shorelines receding, no satellite images of dried riverbeds drawing public alarm. The depletion happens silently, hundreds of feet below the surface, measured only in the incremental drop of water table readings and the deepening of wells that farmers sink at considerable expense. For decades, that invisibility has made comprehensive policy responses difficult to coordinate and even harder to enforce.
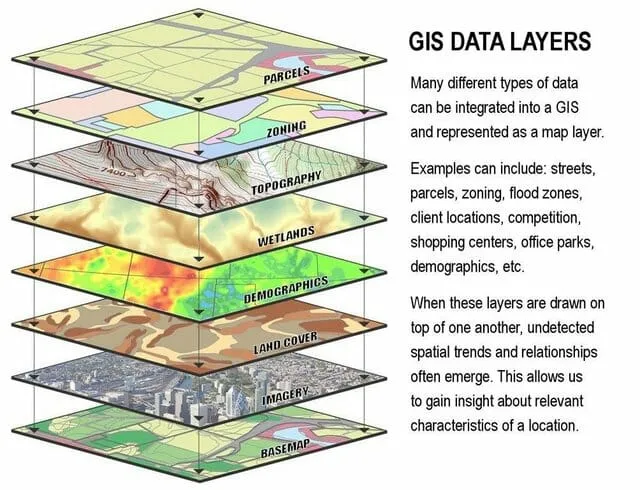
Geographic information systems are beginning to change that equation in fundamental ways. By integrating data from satellite gravity sensors, well monitoring networks, soil surveys, and hydrological models, GIS platforms are producing the first spatially coherent portraits of groundwater stress across the continental United States—and what those portraits show is deeply concerning.
A Crisis Written in Data
The Ogallala Aquifer, which stretches beneath approximately 174,000 square miles across eight Great Plains states from South Dakota to Texas, is among the most studied and most imperiled freshwater systems in the world. Formed over millions of years during the Pleistocene epoch, the Ogallala recharges at a rate so slow—often less than half an inch per year in its southern reaches—that hydrologists frequently classify withdrawals from it as effectively nonrenewable on any human timescale.
Satellite data collected by NASA's Gravity Recovery and Climate Experiment (GRACE) mission, when processed through GIS analytical frameworks, has allowed researchers to quantify water mass loss across the aquifer with a level of spatial resolution previously unavailable. Studies drawing on this data have documented losses equivalent to the entire volume of Lake Huron extracted over roughly six decades of intensive agricultural irrigation. GIS visualization layers these volumetric estimates against land use classifications, precipitation records, and crop water demand models, producing maps that identify not merely where depletion is occurring but which specific zones are approaching thresholds from which recovery becomes functionally impossible.
The picture extends well beyond the Ogallala. In California's Central Valley, one of the most productive agricultural regions on Earth, GIS-integrated subsidence mapping has revealed land surface sinking at rates exceeding a foot per year in some localities—a direct consequence of aquifer compression as water is withdrawn faster than geological structures can accommodate. In Arizona, spatial analysis of well depth data spanning several decades has charted the migration of critically low water table zones outward from urban centers and irrigated farmland, tracing the geometry of overextraction with a precision that older point-based monitoring systems could never achieve.
Spatial Precision as a Conservation Tool
The value of geospatial analysis in this context extends beyond documentation. Conservation scientists are now using GIS platforms to model intervention scenarios with a degree of spatial specificity that transforms how water management strategies can be designed and prioritized.
Recharge zone mapping is one area where this precision yields direct conservation dividends. Aquifer recharge—the process by which surface water percolates downward to replenish underground reserves—does not occur uniformly across a landscape. It concentrates in areas with particular soil permeability, topographic characteristics, and land cover conditions. GIS analysis can identify these zones with high accuracy and overlay them against current land use data to reveal where recharge potential is being suppressed by impervious surfaces, agricultural compaction, or altered drainage patterns.
Conservation practitioners working in Kansas and Nebraska have begun using these recharge zone maps to guide voluntary easement programs, targeting land acquisitions and agricultural practice agreements in areas where surface management changes would yield the greatest hydrological benefit. Rather than applying uniform policy across entire watersheds, this spatially targeted approach concentrates conservation investment where the underlying science indicates it will produce measurable aquifer recovery.
Similar logic applies to irrigation efficiency programs. By cross-referencing satellite-derived evapotranspiration data with crop type maps and soil moisture sensor networks, GIS models can identify parcels where current irrigation applications substantially exceed plant water demand—flagging opportunities for precision irrigation upgrades that could meaningfully reduce withdrawal rates at the aquifer scale if adopted across a sufficient portion of a given region.
Climate Stress and the Compounding Problem
The groundwater depletion crisis does not exist in isolation from broader climatic shifts. Across much of the American West, projections consistently indicate declining snowpack, altered precipitation seasonality, and more frequent and severe drought episodes. These trends place additional pressure on aquifer systems precisely at the moments when surface water availability is most constrained.
GIS modeling is proving essential for understanding how these stressors interact spatially. Drought vulnerability mapping that combines aquifer depletion rates, surface water dependency indices, and climate projection data can identify communities and agricultural regions that face compound water security risks—locations where groundwater buffers are already compromised and where surface water alternatives will become less reliable as temperatures rise.
In Texas and New Mexico, such analyses have highlighted rural communities whose municipal water supplies depend almost entirely on aquifer systems already exhibiting severe depletion trends. The spatial precision of these risk assessments enables state agencies and federal conservation programs to prioritize infrastructure investment and demand management interventions in the places where the need is most acute and the timeline for action most compressed.
The Limits of What Mapping Alone Can Accomplish
Geospatial science is a powerful diagnostic instrument, but it is not a remedy in itself. The data produced by GIS platforms illuminates the scale and geography of groundwater depletion with unprecedented clarity, yet translating that clarity into effective conservation outcomes requires governance structures capable of acting on spatial evidence at the appropriate scale.
Groundwater management in the United States remains largely fragmented across state jurisdictions, local water districts, and a patchwork of regulatory frameworks that vary enormously in their rigor and enforcement capacity. Some states maintain comprehensive metering and reporting requirements that generate the data GIS systems need to function at their highest analytical potential. Others rely on voluntary reporting or have minimal regulatory infrastructure for tracking withdrawals at all.
Conservation GIS practitioners working on aquifer issues frequently cite data access and standardization as among the most significant obstacles to advancing the science. When monitoring well networks are sparse, when reporting is inconsistent, or when historical records have not been digitized in georeferenced formats, the spatial models that could guide conservation investment are correspondingly limited in their resolution and reliability.
Efforts to establish more consistent national groundwater monitoring standards, and to make the resulting data accessible through interoperable platforms, represent a foundational prerequisite for realizing the full conservation potential of geospatial science in this domain.
Reading the Map Before the Wells Run Dry
The groundwater maps that GIS science is now producing represent something genuinely new in the long history of water resource management in the United States: a spatially coherent, quantitatively grounded account of where the country's buried freshwater reserves stand and where they are headed. That account is not reassuring in many of the regions it covers most carefully.
But the same analytical frameworks that document depletion also identify pathways for intervention—recharge zones worth protecting, irrigation practices worth reforming, communities worth prioritizing for infrastructure investment before crisis arrives rather than after. The science is advancing faster than the policy responses it ought to be informing.
For conservation organizations, water managers, and the agricultural communities whose livelihoods depend on aquifers that took geological epochs to fill, the maps are already drawn. The remaining question is whether the institutions responsible for acting on them will do so with the urgency the data demands.