Logistics and Land: What GIS Mapping Exposes About the True Environmental Price of America's Delivery Economy
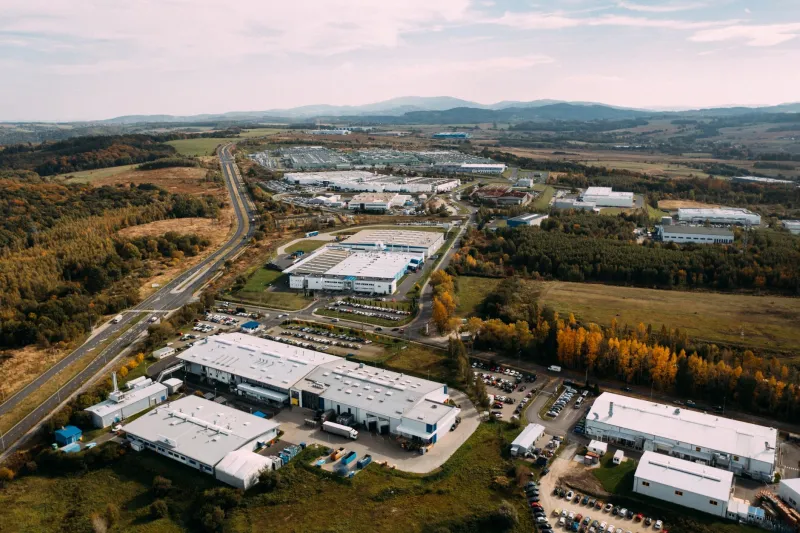
Somewhere between the click of a purchase button and the thud of a package on a front porch, an enormous and largely unmeasured environmental transaction takes place. Trucks idle at loading docks. Concrete spreads across former wetlands and farmfields. Diesel combustion accumulates in atmospheric columns above interstate corridors that were, not long ago, functioning ecological zones. The American logistics economy has quietly become one of the most spatially aggressive industries in the country—and conventional carbon accounting is almost entirely blind to its true reach.
Geographic information systems are beginning to change that.
The Limits of Conventional Carbon Metrics
Traditional emissions accounting for supply chains typically operates at the facility or vehicle level. A warehouse reports its energy consumption. A fleet manager calculates fuel burn per mile. These figures, while useful in isolation, fail to capture what geospatial scientists call the cumulative spatial footprint—the aggregate environmental transformation generated when thousands of individual logistics decisions are made across a continental-scale network.
When GIS analysts layer freight movement data over land use classification maps, the picture changes dramatically. Distribution hubs do not exist in isolation. They anchor clusters of ancillary development: access roads, fuel depots, employee parking infrastructure, and secondary warehousing that extends outward in concentric rings. Multispectral satellite imagery taken over major logistics corridors in the Ohio Valley, the Inland Empire of Southern California, and the I-85 corridor through the Carolinas reveals consistent patterns of land conversion radiating outward from core distribution facilities—conversion that rarely appears in any corporate sustainability report.
Mapping the Invisible Emissions Architecture
One of the most analytically productive approaches involves overlaying high-resolution transportation network data with fuel consumption models derived from commercial freight databases. Researchers using this method have been able to reconstruct what might be called the emissions geometry of specific supply chains—the spatial distribution of carbon output across an entire delivery network rather than at a single point of origin or terminus.
What these reconstructions consistently show is that the highest-emission zones are not the megawarehouses themselves but the intermediate transfer points: regional sorting facilities, cross-dock terminals, and last-mile delivery staging areas that multiply across suburban and exurban landscapes. These nodes generate disproportionate emissions relative to their footprint because they concentrate vehicle idling, short-haul trips, and refrigeration loads in dense geographic clusters.
In the Chicago metropolitan region, GIS-based analysis of freight node distribution mapped against EPA emissions inventory data revealed that logistics-adjacent zones accounted for a substantially higher share of localized NOx and particulate emissions than their proportion of total land use would suggest. The spatial clustering of these impacts—often concentrated in communities with limited regulatory advocacy capacity—adds an environmental justice dimension that purely atmospheric accounting cannot surface.
Land Conversion as Carbon Loss
The carbon calculus of logistics infrastructure extends well beyond combustion. Every acre of land converted to warehouse slab, access road, or truck staging area represents a carbon stock removal. When that land was previously agricultural or, more significantly, wetland or woodland, the conversion generates a carbon debt that persists for decades.
Geospatial analysts have begun quantifying this debt by combining land cover change detection—derived from Landsat and Sentinel-2 time-series imagery—with soil carbon and biomass carbon databases. Applied to the logistics development corridors that have expanded most aggressively since 2015, these analyses suggest that land-conversion-related carbon losses frequently exceed the operational emissions of the facilities themselves over a ten-year horizon.
The Lehigh Valley in Pennsylvania offers a particularly well-documented case. Once characterized by a mix of agricultural land and second-growth forest, the region has absorbed an extraordinary volume of logistics development driven by its proximity to the Northeast consumer corridor. Sequential land cover analysis shows that between 2010 and 2023, the area lost thousands of acres of vegetated land cover to impervious surfaces. The carbon implications of that transition, calculated against regional soil carbon density figures, represent a liability that no logistics company operating in that corridor has publicly acknowledged.
Route Optimization and Its Ecological Shadow
The industry's response to emissions scrutiny has leaned heavily on route optimization algorithms—software-driven tools that minimize fuel consumption by identifying the most efficient paths through a delivery network. These tools are genuinely effective at reducing per-package emissions within an existing network. What they cannot do is address the emissions generated by the network's physical structure.
GIS analysis reveals a structural paradox in this optimization logic. As route efficiency improves, the economic viability of adding new distribution nodes increases, because the marginal cost of serving additional geographic areas declines. The result is network densification: more facilities, more access infrastructure, more land conversion, all justified by the efficiency gains of the optimization systems themselves. Spatial modeling of logistics network growth over the past decade shows this pattern operating consistently across major metropolitan regions.
Demanding Spatial Accountability
The methodological tools required to perform this kind of analysis are not exotic. Land cover change detection, freight network overlay analysis, carbon stock modeling, and emissions spatial interpolation are all established components of the conservation GIS toolkit. What has been absent is the institutional pressure—and in some cases, the regulatory mandate—to apply them to supply chain infrastructure at scale.
Several states have begun moving in this direction. California's Advanced Clean Fleets regulation incorporates some spatial equity considerations, and New Jersey has piloted warehouse siting criteria that reference cumulative environmental burden mapping. These are meaningful steps, but they address operational emissions rather than the full spatial carbon footprint that GIS analysis is now capable of measuring.
The science is ahead of the policy. Geospatial researchers can now reconstruct, with reasonable precision, the total environmental transaction embedded in a single two-day delivery. The question is whether that precision will be brought to bear on the regulatory frameworks that govern how and where logistics infrastructure is permitted to grow—or whether the phantom footprint will remain invisible by institutional design.
Conservation science has a direct stake in that answer. The landscapes being consumed by distribution infrastructure are not abstract policy categories. They are habitat corridors, carbon sinks, floodplain buffers, and agricultural soils. Mapping their loss is the first step toward preventing it.