Oxygen Deserts: How Spatial Science Is Drawing a Direct Line Between Corporate Agriculture and Coastal Ecological Collapse
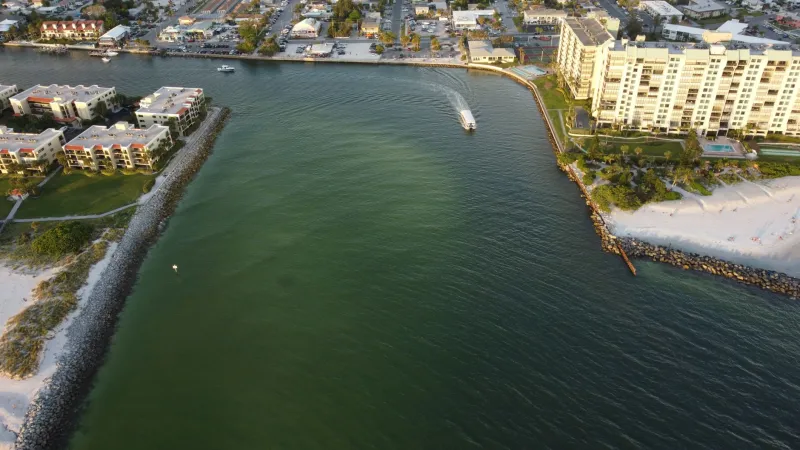
Every summer, a mass suffocation event unfolds along the Louisiana and Texas coastlines. The Gulf of Mexico's hypoxic zone—a sprawling expanse of water so depleted of dissolved oxygen that most marine life either flees or dies—expands to cover thousands of square miles of what should be productive fishery habitat. Scientists have monitored this phenomenon for decades. What has remained frustratingly elusive is a precise, defensible accounting of where the problem originates and who, specifically, bears responsibility for it.
Geographic information systems are beginning to provide that accounting.
Researchers at universities and federal agencies are now deploying sophisticated spatial modeling tools that integrate satellite imagery, watershed hydrology data, land use records, and corporate agricultural footprints to construct something that did not previously exist at this level of resolution: a map of culpability. The results are producing both scientific clarity and considerable institutional discomfort.
What a Hypoxic Zone Actually Is—and Why It Forms
Hypoxia occurs when dissolved oxygen in a water column drops below the threshold that most aquatic organisms require to survive. In coastal systems, the primary driver is eutrophication—the over-enrichment of water with nutrients, principally nitrogen and phosphorus. These nutrients fuel explosive algal growth. When that algae dies and sinks, microbial decomposition consumes oxygen faster than natural processes can replenish it. The result is a biological dead zone.
The Gulf of Mexico's hypoxic zone is the most extensively documented in the United States, but it is far from unique. The Chesapeake Bay has struggled with hypoxia for generations, its mid-channel waters turning lethally anoxic each summer. Portions of Long Island Sound, the Albemarle-Pamlico estuary in North Carolina, and Hood Canal in Washington State exhibit similar seasonal collapses. In nearly every case, agricultural runoff—carrying synthetic fertilizers and animal waste—is the dominant nutrient source.
What GIS analysis is now capable of doing is following that runoff upstream to its point of origin with a precision that was computationally impractical just a decade ago.
Tracing the Invisible River
The Mississippi River Basin drains approximately 41 percent of the contiguous United States. Every tributary, tile drain, and irrigation return flow within that basin eventually contributes to what arrives at the Gulf. For years, this geographic reality provided a kind of diffusion of responsibility. When a nutrient load is spread across 1.2 million square miles of watershed, it becomes politically and legally convenient to treat it as a systemic problem rather than an operational one.
Modern hydrological GIS modeling is collapsing that convenience.
Using digital elevation models, stream network datasets, and nutrient transport algorithms, researchers can now construct flow-path analyses that track dissolved nitrogen and phosphorus from specific parcels of agricultural land through the dendritic network of streams and rivers to their coastal terminus. When those flow paths are overlaid against corporate land ownership records, commodity production data, and fertilizer application rates derived from remote sensing, the picture that emerges is not of a diffuse, anonymous problem. It is of identifiable operations contributing measurable loads to downstream systems.
A research team working within the Mississippi-Atchafalaya River Basin has demonstrated this approach at scale, linking county-level nutrient surpluses—derived from satellite-based crop mapping and publicly available fertilizer sales data—to modeled nitrogen export rates reaching the Gulf. The spatial clustering of high-export areas corresponds closely with regions dominated by large-scale commodity corn and soybean production, much of it under the operational control of a relatively small number of corporate agricultural entities and contract farming arrangements tied to major food and agribusiness companies.
The Chesapeake Case: Finer Resolution, Harder Questions
In the Chesapeake Bay watershed, the spatial analysis has advanced to an even more granular level. The Bay's relatively compact drainage area—spanning parts of six states and the District of Columbia—has made it a natural laboratory for high-resolution nutrient source attribution.
State and federal agencies have invested heavily in the Chesapeake Bay Program's Phase 6 watershed model, which integrates land use, management practices, and atmospheric deposition data to estimate nutrient and sediment loads from specific source sectors. When this modeling infrastructure is coupled with GIS layers identifying concentrated animal feeding operations, corporate poultry and hog integrators, and specific farm operator boundaries, researchers can produce attribution estimates that go well beyond generic sector-level accounting.
The poultry industry's spatial footprint on the Delmarva Peninsula has received particular attention. Satellite-derived land cover analysis combined with permit databases and corporate integrator records allows researchers to map the density of broiler operations—and their associated litter application fields—against sub-watershed nutrient loading estimates. The correlation is not subtle. Areas with the highest concentrations of contract poultry production under major integrator companies show consistently elevated phosphorus export rates, and those exports trace through the Pocomoke, Nanticoke, and Wicomico river systems into the Bay's already stressed tidal waters.
Corporate Response: From Resistance to Reluctant Engagement
The emergence of spatially explicit supply chain accountability has not been universally welcomed by the agricultural and food industries. For years, major commodity buyers and food manufacturers maintained that nutrient pollution was a farm-level issue, largely beyond their operational control. GIS-based source attribution is making that position increasingly difficult to sustain.
Some corporations are responding by developing their own internal spatial monitoring programs. Several large food companies with significant grain and oilseed procurement operations have begun piloting field-level sustainability tracking systems that incorporate soil health metrics, fertilizer application data, and watershed sensitivity indices. The stated goal is to identify high-risk sourcing geographies and work with supplier farms on nutrient management improvements.
Whether these initiatives represent genuine operational reform or sophisticated reputational management is a question that independent researchers are beginning to examine with the same spatial rigor applied to the pollution problem itself. Comparing corporate-reported sustainability metrics against remotely sensed land condition indicators and modeled nutrient export trends offers one avenue for verification—an application of GIS that essentially functions as an external audit of corporate environmental claims.
The Regulatory and Legal Horizon
Beyond corporate voluntary action, the maturation of spatial attribution science carries significant implications for environmental regulation and litigation. The Clean Water Act's framework for addressing nonpoint source pollution has historically relied on broad planning mechanisms rather than source-specific accountability, in part because demonstrating a traceable connection between a specific operation and a downstream water quality impairment was scientifically and legally complex.
That complexity is diminishing. As GIS-based nutrient transport models become more refined and their outputs more defensible in technical and legal proceedings, the evidentiary foundation for source-specific regulatory action strengthens. Environmental law practitioners have begun citing spatial attribution analyses in administrative proceedings and litigation related to Bay and Gulf water quality, signaling that the science is crossing from the academic into the applied regulatory domain.
Mapping Accountability Forward
The hypoxic zones along America's coastlines did not form in the absence of human decision-making. They formed as the cumulative consequence of specific land management choices, chemical application decisions, and corporate procurement arrangements that prioritized yield and cost efficiency over downstream ecological consequence. For most of the period during which these dead zones have expanded, the spatial connection between those decisions and their ecological outcomes was understood in general terms but not in the precise, attributable terms that compel institutional response.
Geographic information systems are closing that gap. The maps being produced today do not merely describe where oxygen deserts exist. They describe, with increasing specificity, the upstream choices that created them. That shift—from description to attribution—is arguably the most consequential development in coastal water quality science in a generation.
For conservation practitioners, it offers new leverage. For corporations operating within sensitive watersheds, it represents a transparency they cannot opt out of. And for the marine ecosystems suffocating beneath the surface of American coastal waters each summer, it may represent the beginning of a more honest reckoning with the true cost of the food system that feeds the nation.